Case study · Dashboard
Numbers thatansweryour questions.
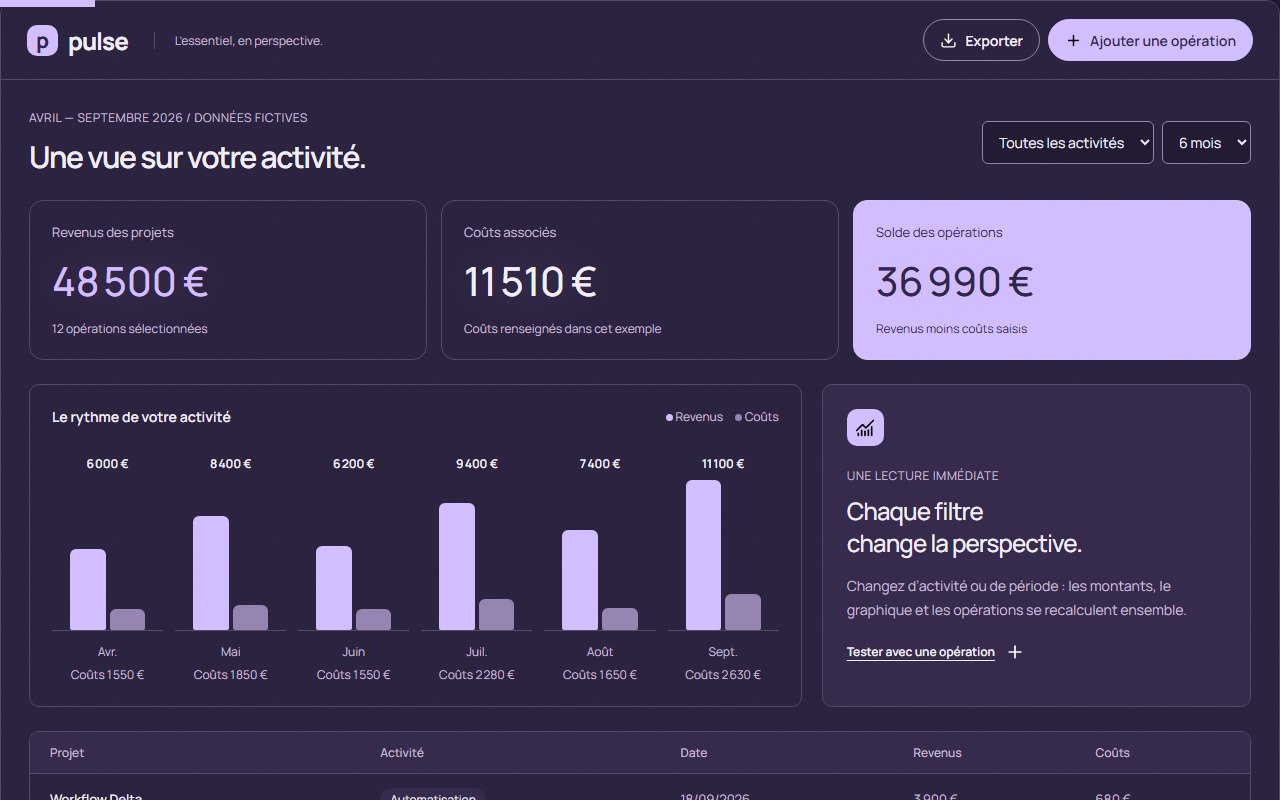
Pulse is a dashboard prototype built for this demonstration: twelve fictional entries over six months, with revenue, costs and a balance. Change the activity or the period: the indicators, the chart and the table update together.
01 · Starting point
The numbers are there, but nobody reads them.
Many businesses keep their numbers in files: a billing export, a spreadsheet, a CSV. To know where things stand, you have to open, sort, add up, and start over next month.
Pulse shows the opposite: the essentials at a glance, and the ability to change viewpoint without redoing everything. Three goals.
See the essentials at a glance
Revenue, costs and balance, in three numbers.
Change perspective without redoing everything
An activity, a period: everything follows.
Keep control of the data
Add an entry, export the selection.
02 · What was designed
Six elements, one calculation.
- 01
Three indicators
Project revenue, related costs and the balance, with the number of entries selected.
- 02
A monthly chart
Revenue and costs by month, with the amounts written under each month.
- 03
Two filters
The activity (all, websites, applications, automation, design) and the period (6 months or 3 months).
- 04
A table of entries
Project, activity, date, revenue, costs, from the most recent to the oldest.
- 05
Adding an entry
A validated form: a name, a date between April and September 2026, positive amounts with at most two decimals.
- 06
Exporting the selection
The filtered view exports to CSV: date, project, activity, revenue, costs.
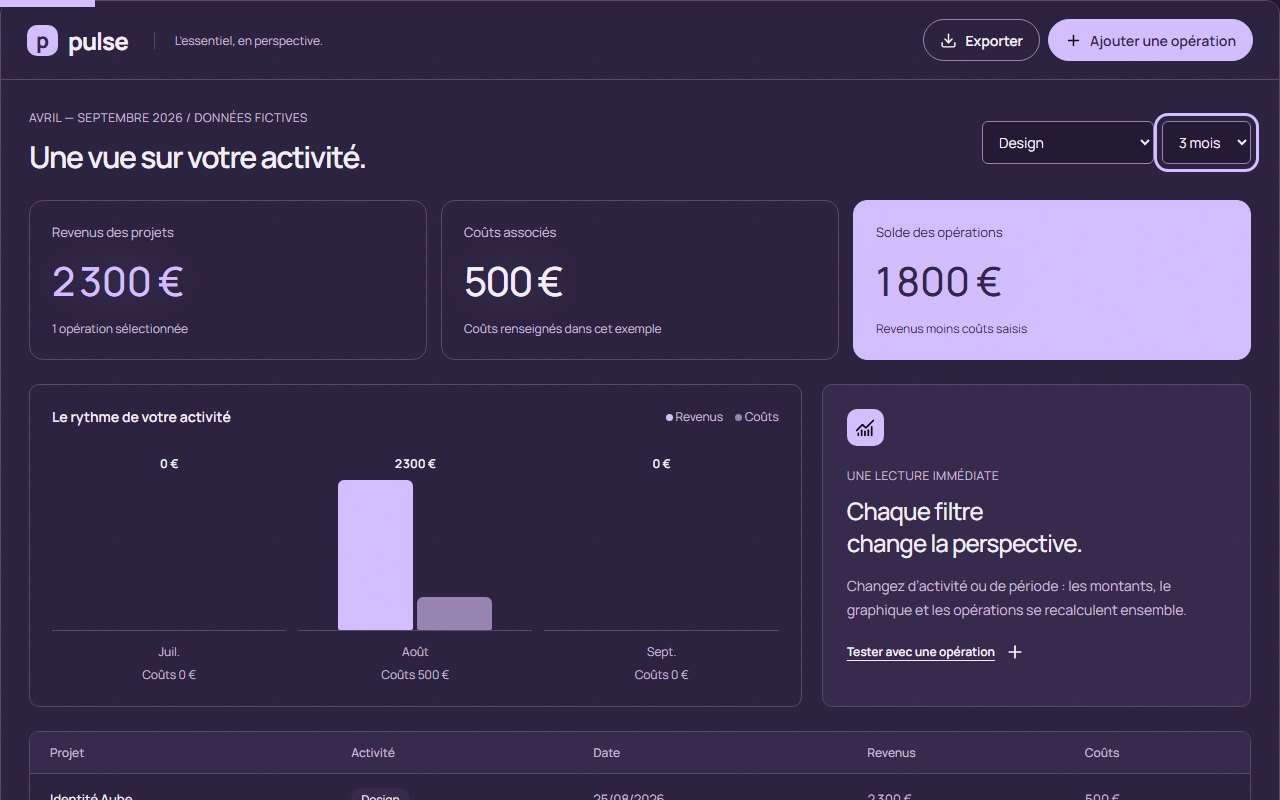
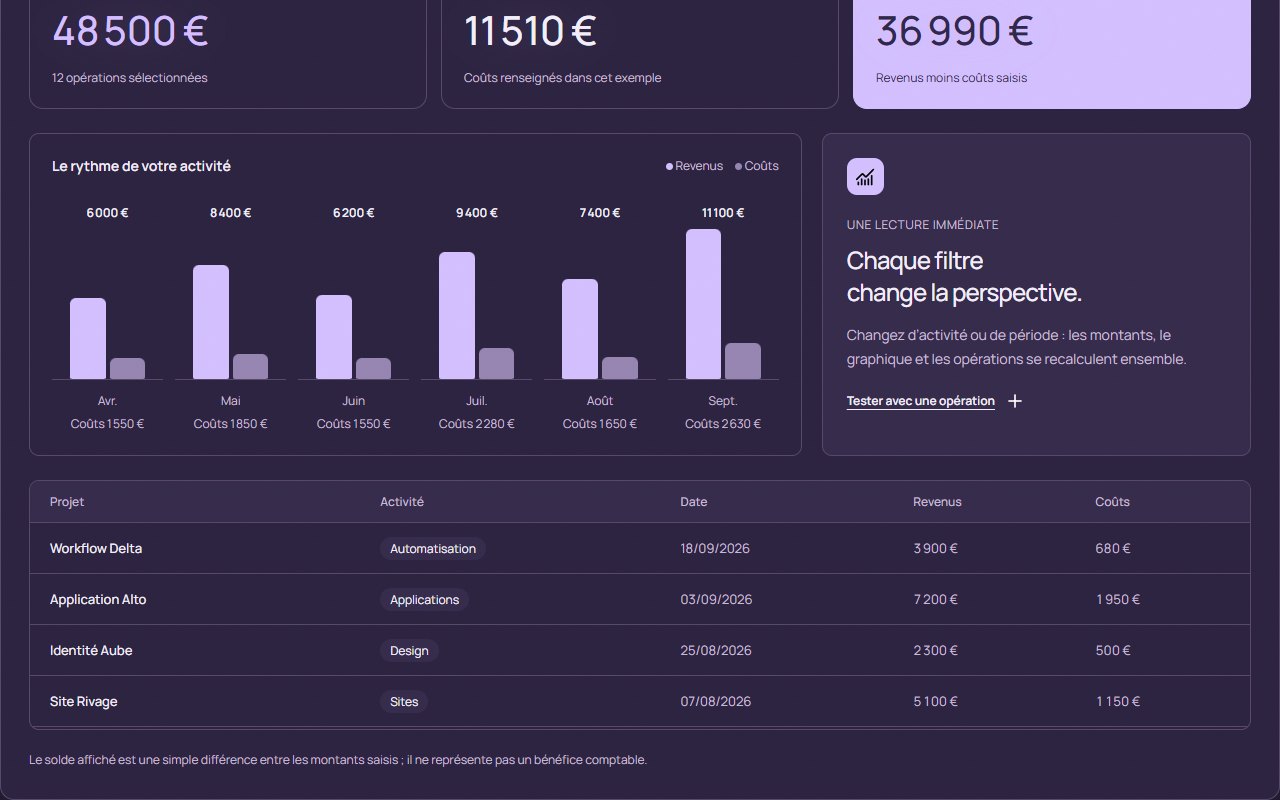
Filters update the indicators, chart and table rows together. Fictional data. The captures are of the French interface.
Try it · the dashboard
Change perspective.
The same twelve fictional entries, the same calculation as in the prototype. Pick an activity and a period, add an entry, look at the export.
A view of your business.
- Revenue
- Costs
Change the activity or period: the totals, chart and entries update together.
| Project | Activity | Date | Revenue | Costs |
|---|---|---|---|---|
| New portal (example) | Applications | 25/09/2026 | €3,000 | €900 |
| Workflow Delta | Automation | 18/09/2026 | €3,900 | €680 |
| Application Alto | Applications | 03/09/2026 | €7,200 | €1,950 |
| Aube identity | Design | 25/08/2026 | €2,300 | €500 |
| Rivage website | Websites | 07/08/2026 | €5,100 | €1,150 |
| Workflow Ligne | Automation | 20/07/2026 | €3,200 | €580 |
| Application Tempo | Applications | 06/07/2026 | €6,200 | €1,700 |
| Kanso presentation | Design | 24/06/2026 | €1,400 | €350 |
| Forma website | Websites | 09/06/2026 | €4,800 | €1,200 |
| Workflow Atlas | Automation | 21/05/2026 | €2,600 | €450 |
| Nova portal | Applications | 04/05/2026 | €5,800 | €1,400 |
| Sillage identity | Design | 23/04/2026 | €1,800 | €600 |
| Horizon project | Websites | 08/04/2026 | €4,200 | €950 |
The balance is the difference between the amounts entered. It is not an accounting profit figure.
03 · Design choices
Four decisions about reading.
A
One calculation, three views
The indicators, the chart and the table come from the same function, applied to the same filtered entries. They cannot contradict each other.
Amounts are computed in cents to avoid rounding drift.
B
Readable amounts, a measured contrast
Amounts are written under each month: no need to guess a value from a bar. Two colours only, lavender for revenue and a violet grey for costs.
Contrast was calculated on 29 September 2026 for two colour pairs on the site. A targeted calculation, not a full audit or a certification.
Ink on lavender paper
11.68 : 1
#30264D on #ECEAF4
Light text on the dark background
14.73 : 1
#F3EFFA on #211A32
C
Honest about what a number means
The balance is simply the difference between the amounts entered; it is not an accounting profit figure. The note sits under the table, not on a separate page.
Same logic as everywhere in the prototype: fictional data, clearly marked, reset in one click.
D
Controlled entries
A date must exist and fall between April and September 2026; amounts must be non-negative, at most €1,000,000, with no more than two decimals. Otherwise the form says why.
E
An export wary of formulas
In the CSV, any cell starting with =, +, @ or - is neutralised, so a spreadsheet does not run it as a formula.
04 · Technical side
Data on one side, a screen on the other.
- 12sample entries
- 6months, April to September 2026
- 2filters: activity and period
- 1shared calculation function
- 0connections to an external service
The calculation, entry validation and export live in a module separate from the screen. They can be tested without opening a page.
On a delivered dashboard, data would come from a file, a billing export or a database, cleaned and reconciled, then refreshed on demand. The screen and the reading stay the same.
05 · What a business would receive
A dashboard built on its numbers.
- The complete dashboard, its source files and its publication on hosting in its own name.
- Its real data: Excel or CSV file, billing export, cleaned and reconciled.
- The indicators chosen with it, in place of revenue, costs and balance.
- Hands-on explanations: add data, read the filters, export.
Scope, price and timing are set out in a quote before starting.
Terminus · Contact
Your data is there, but hard to read?
Tell me what you would like to see at a glance. First conversation free, reply within 24 hours.
contact@tramevia.com Terminus · 07 / 07TrameviaWebsite and identity · FR + EN · back to the home page→Pulse is a personal prototype created for this case study. The projects, activities and amounts shown are fictional. No data entered is sent or stored.