Service · Data and automation
Less spreadsheet.Moreanswers.
Do you spend hours sorting, cleaning and adding up the same files every month? I build dashboards that answer your questions and scripts that prepare your files for you, installed on your side, with no subscription.
01 · Two needs
See clearly, and stop starting over.
The numbers are often already there: a billing export, a spreadsheet, a file from a supplier. What is missing is a quick read, and a way to stop repeating the same manual steps.
See what matters
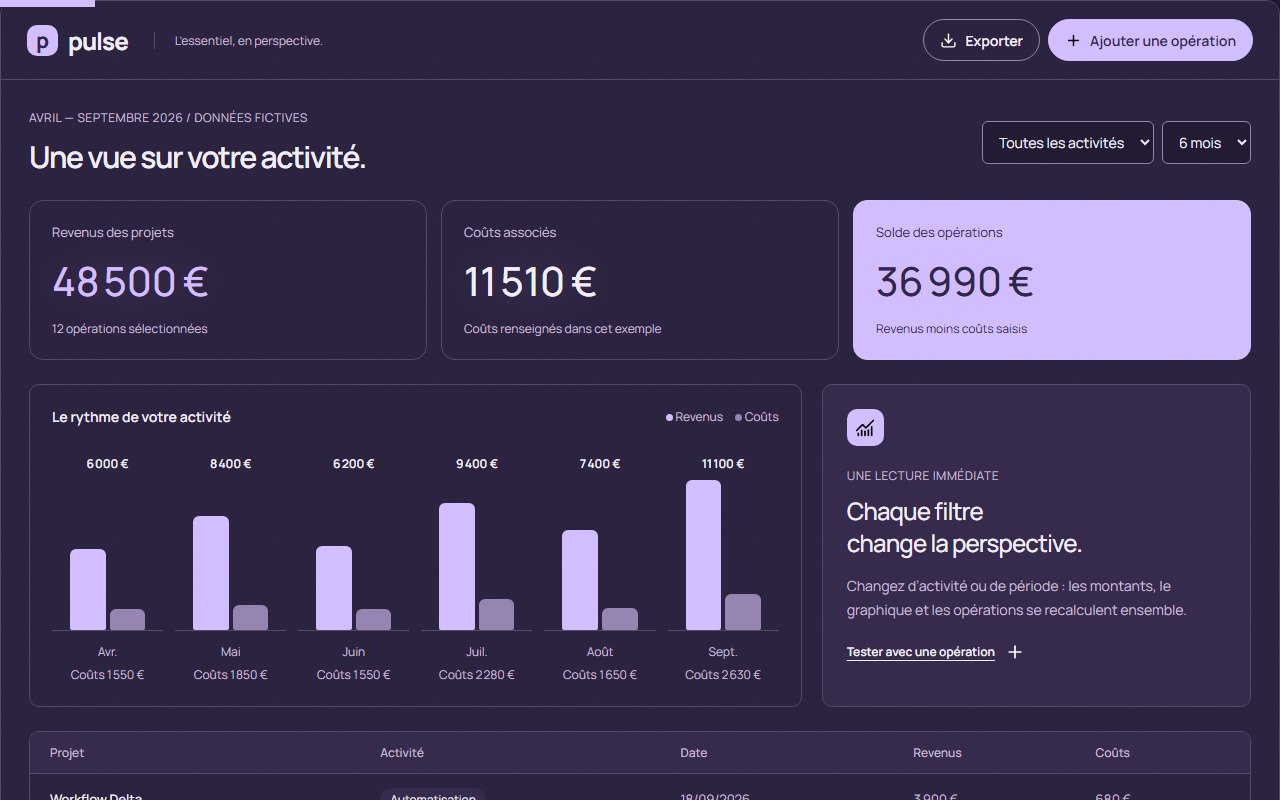
A dashboard: indicators, filters, chart and export.
Stop copy-pasting
A script: cleaning, matching, formatting and an anomaly report.
Stay in control
Your files stay with you and doubtful cases are flagged to you.
02 · Dashboard
Your numbers, in one view.
- 01
The right indicators
Chosen with you, around the decisions you actually make.
- 02
Useful filters
An activity, a period, a client: everything recalculates together.
- 03
Checked figures
Reconciled with your reference totals before delivery.
- 04
Gaps stay visible
A missing value is flagged, never turned into a misleading total.
- 05
Readable on a phone
Indicators first, then filters and chart.
- 06
Simple updates
Drop in the new file, refresh: a one-page guide explains it.
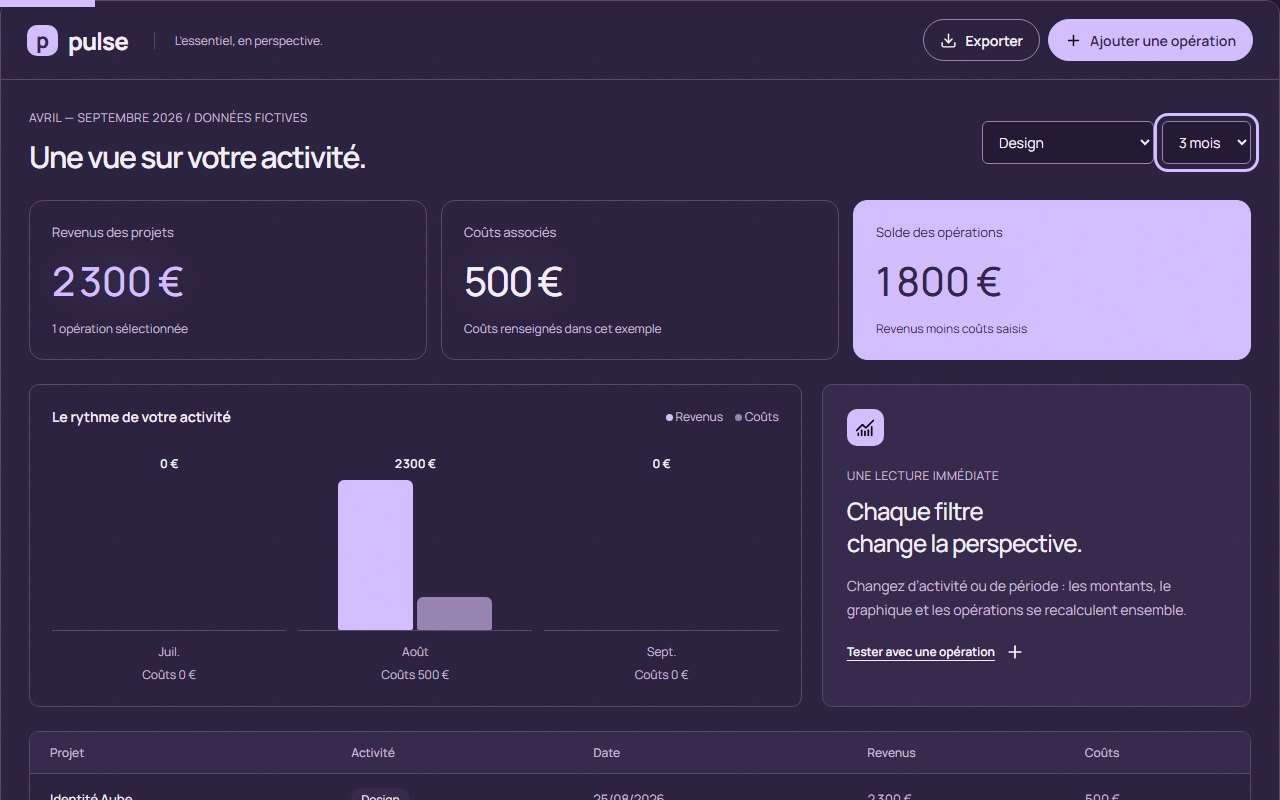
One filter changes, everything follows. Fictional data.
03 · Automation
The same file, clean, every time.
- Dates, amounts and labels brought to one format.
- Duplicates removed, files matched, columns reorganised.
- Doubtful rows listed separately with the reason: you decide.
- A script you can run again, or a one-off cleanup for a single need.
Example made with fictional data.
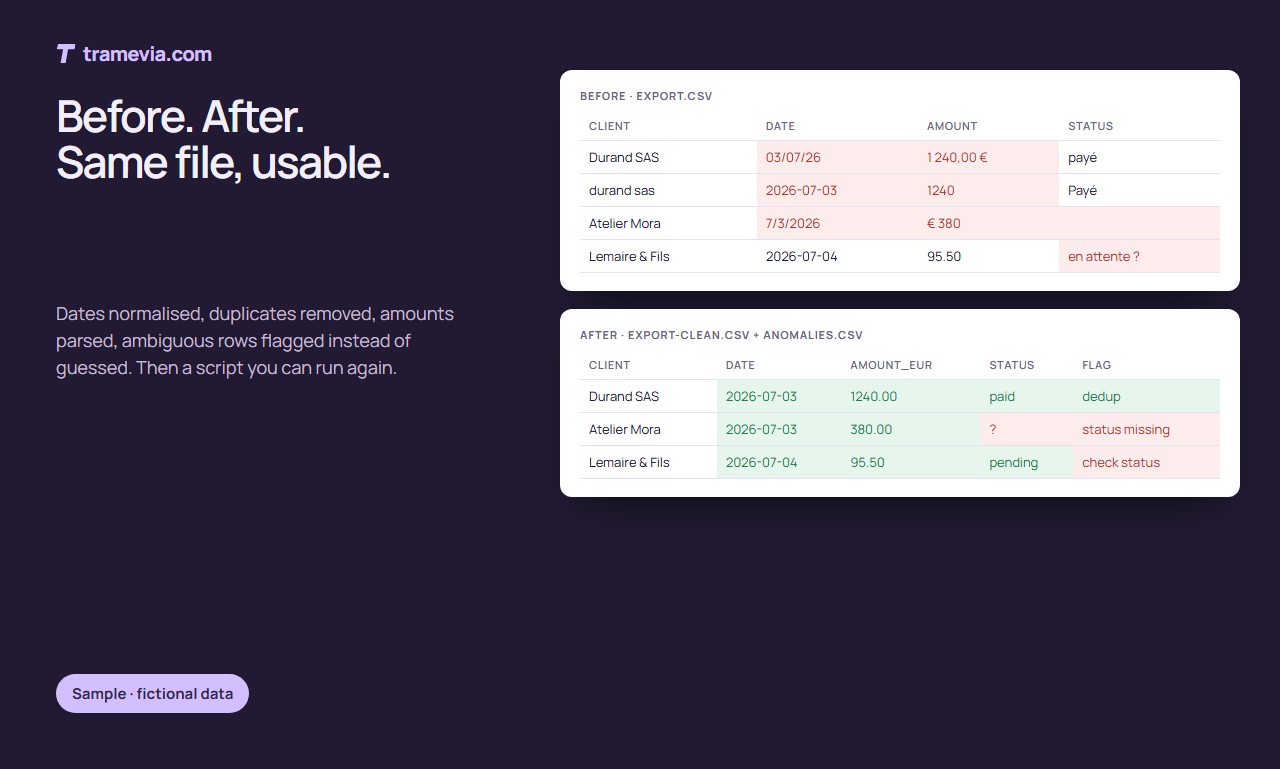
Before and after: the same file, usable. Fictional data.
04 · Examples to try
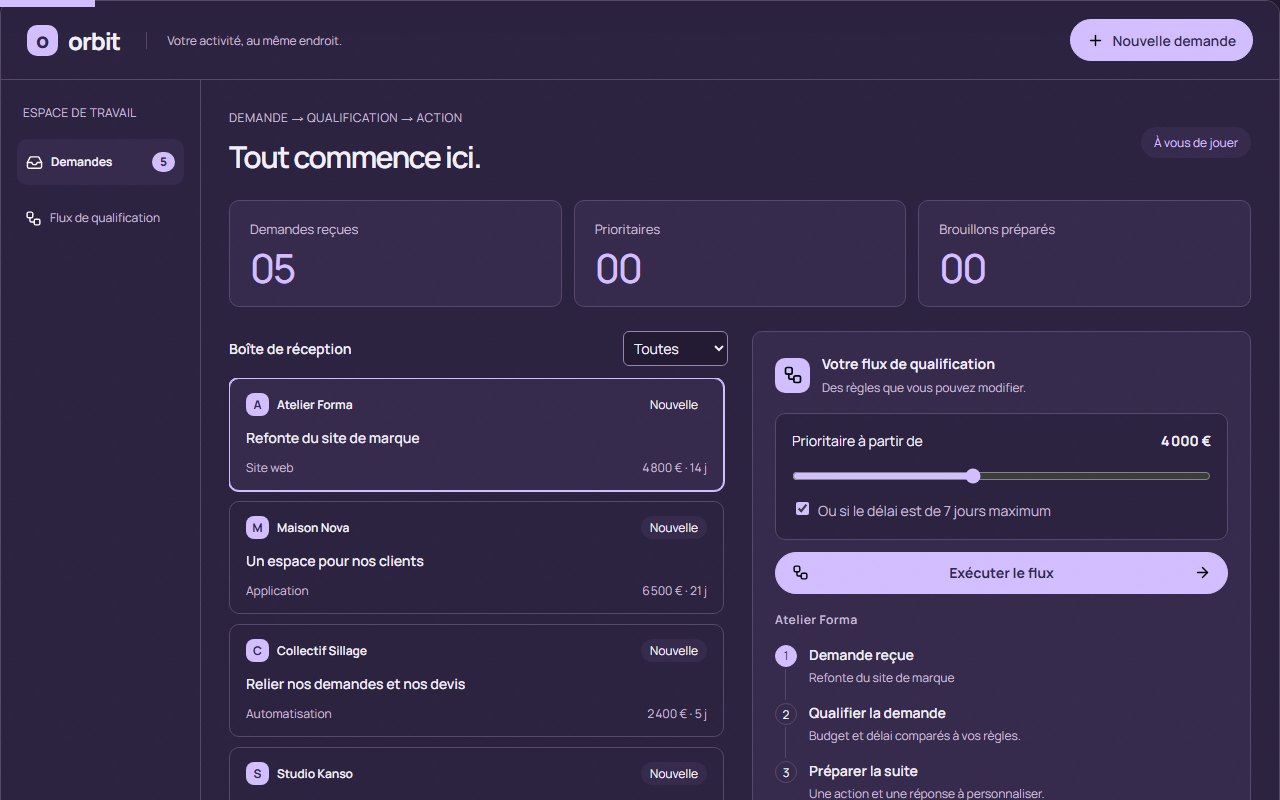
Two prototypes to play with.
Fictional data, working tools. Each case study explains the choices.
05 · Frequently asked questions
Before you send me your files.
Q
Does my data stay with me?
Yes. I work from an anonymised sample, and the delivered tool runs on your computer or your hosting. Nothing is sent to a third-party service.
Q
Which tools do you use?
Dashboards open in your browser with nothing to install. Scripts are written in Python, with a one-page install guide and a single command to run.
Q
My files are messy. Is that a problem?
It is the most common case. Cleaning is part of the work, and ambiguous rows are listed for you rather than guessed.
Q
Is there a subscription?
No. You receive the source files and the tool is yours. Any later change is quoted separately, if you need it.
Q
How much does it cost?
It depends on the number of files, rules and indicators. The price is set in a free quote, based on an anonymised sample.
Terminus · Contact
Do your files take too much of your time?
Describe what you do every month and what you would like to see. Free first conversation, reply within 24 hours.
contact@tramevia.com Another serviceBusiness websiteAn online presence that makes people want to write to you→Pulse and Orbit are personal prototypes; the data shown is fictional.